
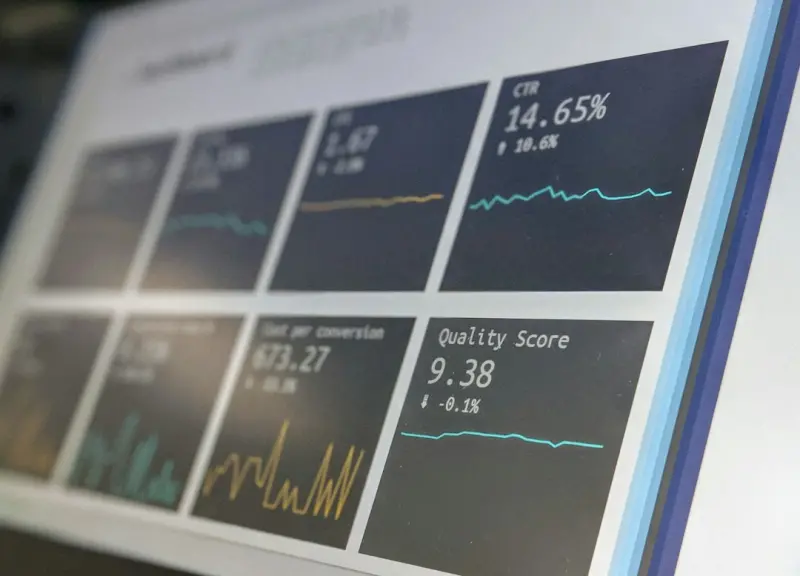
Why Real‑Time Dashboards Are No Longer a Luxury, But a Necessity
When I first stepped into a digital‑marketing role, my daily ritual involved opening a spreadsheet at 9 a.m., scrolling through a dozen CSV exports, and praying the data would line up before the first client call. Fast forward a few years, and the landscape has shifted dramatically. Today, campaigns launch, pivot, and scale in minutes, and the margin for error has shrunk to seconds. If you’re still relying on static reports that are a day or two old, you’re essentially navigating with a blindfold.
Real‑time dashboards have become the cockpit for modern marketers—a place where every KPI, from paid‑media ROAS to organic sentiment, lives side‑by‑side, refreshed every few seconds. But there’s a twist: the rise of data‑privacy regulations and consumer expectations means that the “real‑time” promise must also be privacy‑first. In this post, I’ll walk you through the architecture, the toolset, and the cultural shift needed to build a dashboard that respects privacy while delivering instant insights.
The Core Pillars of a Privacy‑First Real‑Time Dashboard
Think of a dashboard as a three‑legged stool. If one leg is weak, the whole thing wobbles. The three pillars are:
- Data Integration Layer – Seamlessly pulling data from ad platforms, CRM, analytics, and first‑party sources.
- Privacy Guardrails – Enforcing consent, anonymization, and compliance at every step.
- Visualization Engine – Turning raw streams into actionable visuals that marketers can act on without needing a data science degree.
Each pillar demands a different set of tools and a disciplined mindset. Let’s unpack them.
1. Data Integration Without the Data‑Lake Headache
Traditional data pipelines often rely on a centralized data lake, which can become a monolithic beast that’s hard to manage, slow to refresh, and a liability when it comes to GDPR or CCPA compliance. Instead, consider a distributed, event‑driven approach:
- API‑First Connectors – Platforms like AI‑driven evolution of search have demonstrated the power of direct, low‑latency API pulls. Services such as Supermetrics, Funnel, and native Zapier triggers let you stream data into a processing layer in near real‑time.
- Message Queues – Tools like Apache Kafka, Amazon Kinesis, or even the more SaaS‑friendly Confluent Cloud act as the nervous system, buffering events and ensuring you never lose a click, conversion, or unsubscribe signal.
- Transformation as Code – Use dbt (data build tool) or Meltano to define transformation logic in version‑controlled SQL. This keeps your metric definitions transparent and reproducible across the team.
By avoiding a monolithic lake, you reduce the attack surface for data breaches and make it easier to apply field‑level encryption or tokenization before the data ever lands in a visualization tool.
2. Embedding Privacy Guardrails Into the Pipeline
Privacy isn’t an after‑thought; it’s a design principle. Here’s how to bake it in:
- Consent Management Integration – Connect to your consent management platform (CMP) via webhook. Only forward events that have explicit user consent for marketing analytics. For instance, if a user opts out of “behavioral tracking,” their event payload should be stripped of identifiers before it reaches any downstream system.
- On‑the‑Fly Anonymization – Use hashing (e.g., SHA‑256) or tokenization for personal identifiers like email or IP address. Services like AWS Glue or Azure Purview can apply these transformations in real time.
- Purpose‑Based Data Tagging – Tag each data point with a purpose label (e.g., “ad‑performance” vs. “customer‑support”). This allows you to enforce policies that prevent cross‑purpose data leakage, a common compliance pitfall.
- Audit Trails – Log every transformation and access event. Tools such as Datadog, Splunk, or the open‑source OpenTelemetry framework can help you maintain a tamper‑evident audit log, which is invaluable during a regulator audit.
These steps not only keep you on the right side of the law but also build trust with your audience—an intangible asset that often translates into higher conversion rates.
3. Visualization Engine That Serves Marketers, Not Data Engineers
Once the data is clean, consented, and flowing, you need a front‑end that translates that stream into insights. The market is saturated with BI tools, but many fall short on two critical aspects for marketers: speed of setup and ease of sharing.
My go‑to stack includes:
- Looker Studio (formerly Data Studio) – Great for quick, shareable dashboards, especially when you need to embed them into internal portals or Slack.
- Chartbrew – An open‑source, no‑code dashboard builder that connects directly to APIs and databases. It’s perfect for teams that want to prototype in minutes without waiting on a developer.
- Metabase – For deeper analysis, Metabase offers a query‑builder UI that non‑technical users can master within a week.
Regardless of the tool, the key is to establish a single source of truth for each KPI. That means standardizing naming conventions (e.g., “Cost per Acquisition” should never be abbreviated as “CPA” in one chart and “Cost/Acq” in another). Consistency reduces cognitive load and prevents misinterpretation during fast‑paced decision cycles.
Turning the Vision Into Reality: A Step‑by‑Step Blueprint
Below is a practical roadmap you can follow, whether you’re a solo marketer or part of a cross‑functional growth team.
Step 1: Map Your KPI Universe
Start by listing every metric you currently track and every metric you wish you had. Group them by funnel stage (Awareness, Consideration, Conversion, Retention) and assign owners. This matrix becomes the blueprint for your data integration plan.
Step 2: Audit Existing Data Sources
Identify every platform that holds relevant data: Google Ads, Meta Business Suite, HubSpot, Segment, Shopify, etc. For each, verify whether they offer a real‑time API or webhook. Document the rate limits and authentication methods (OAuth2, API keys).
Step 3: Choose Your Integration Middleware
If you have a developer on hand, a custom Node.js or Python microservice that pulls from each API and pushes to a Kafka topic works well. If you prefer a no‑code approach, tools like DIY internal‑tool toolkit can be repurposed to orchestrate API calls and queue events using platforms such as Integromat or n8n.
Step 4: Implement Privacy Filters Early
Before any event hits your visualization layer, run it through a “privacy middleware.” This could be a lightweight Lambda function that checks consent flags and hashes identifiers. By making this step immutable (e.g., by storing the code in a version‑controlled repo), you guarantee that every downstream system respects the same privacy contract.
Step 5: Build the Real‑Time Data Model
Define a unified schema—think of it as a data contract. For example:
{
  "event_id": "uuid",
  "timestamp": "ISO8601",
  "source": "google_ads",
  "event_type": "click",
  "campaign_id": "string",
  "ad_group_id": "string",
  "cost": "float",
  "user_consent": {
    "marketing": true,
    "analytics": false
  },
  "hashed_user_id": "sha256"
}
This schema ensures that every downstream query uses the same field names, reducing translation errors.
Step 6: Wire Up the Dashboard
Connect your visualization tool directly to the processed event stream (e.g., a materialized view in Snowflake or a read‑only replica in PostgreSQL). Use incremental refreshes so the charts update every 30 seconds without a full page reload.
Step 7: Establish Governance and Alerting
Set up alerts for data anomalies (e.g., sudden drop in conversion rate) and for privacy breaches (e.g., an event without a consent flag). Tools like PagerDuty or even Slack bots can deliver real‑time notifications to the right stakeholders.
Culture Matters: Getting the Team to Adopt Real‑Time Thinking
Technology is only half the battle. Your team must internalize a “real‑time first” mindset:
- Daily Stand‑Ups with Dashboard Review – Start each morning by scanning the dashboard for spikes or dips. Treat any anomaly as a hypothesis to test.
- Empower “Data Champions” – Designate a marketer who is comfortable diving into the data model and can troubleshoot broken pipelines, reducing bottlenecks.
- Celebrate Privacy Wins – Publicly recognize campaigns that achieve high performance while maintaining strict privacy standards. This reinforces the value of privacy‑first design.
When everyone sees the dashboard as a shared, trustworthy source of truth, you’ll notice faster iteration cycles and higher morale.
Future‑Proofing: Anticipating the Next Wave of Marketing Tools
What’s on the horizon? A few trends I’m watching closely:
- Generative AI for Insight Summaries – Imagine a dashboard that not only shows you the numbers but also writes a concise, data‑driven narrative each morning. Early experiments with LLMs in this space are promising.
- Edge‑Based Analytics – As browsers become more capable, processing some data at the edge (e.g., in Cloudflare Workers) can further reduce latency and improve privacy by keeping raw user data on the client side.
- Zero‑Party Data Platforms – Tools that let users voluntarily share preferences in exchange for personalization will become a new pillar of the privacy‑first stack.
By building a flexible, modular dashboard today, you position your team to plug‑in these emerging capabilities without a massive overhaul.
Wrapping Up: From Data Chaos to Real‑Time Clarity
In the era of instant gratification, marketers can’t afford to make decisions on yesterday’s data. Yet, the regulatory environment demands that we treat every data point with the utmost respect. The good news is that you don’t need a massive engineering team to strike that balance. By leveraging modern, API‑first connectors, embedding privacy filters early, and choosing a visualization stack that empowers non‑technical users, you can create a dashboard that is both real‑time and privacy‑first.
Take the first step today: map your KPI universe, audit your data sources, and prototype a simple webhook‑to‑Chartbrew pipeline. You’ll be surprised at how quickly the fog lifts, revealing a clear, actionable view of your marketing performance—one that respects your audience and fuels smarter growth.

Mei Chen is a dynamic professional who brings a unique blend of skills to Blogging Fusion. As a key contributor to the Blogging Fusion platform, she leverages her writing expertise to create engaging content that resonates with our audience.
Related Posts
The Rise of Privacy‑Centric Marketing Tools: How Data Clean Rooms Are Redefining Customer Insight
Explore how privacy‑centric marketing tools, especially data clean rooms, enable marketers to blen... Read More

Stitching Together Your Martech Stack: An Integration Playbook for Marketers
A fragmented Martech stack wastes time and money. This post walks you through a step‑by‑step int... Read More

Beyond the Dashboard: Adaptive Marketing Toolsets for B2B Growth
Learn how to design a flexible, problem‑first digital marketing stack that integrates AI experimen... Read More
Top Posts

The Art of Unscripted Exploration: Why Randomness Beats Itineraries
Explore how shedding detailed travel plans in favor of spontaneous, theme‑driven journeys can boost creativity, empathy, and innovation, turning every trip in...Read More

Reclaiming Your Inbox: A Comprehensive Guide to Stopping SPAM Email in Gmail
The digital age has brought unprecedented convenience and connectivity, but it's also ushered in an unwelcome guest: SPAM email. For many, the daily deluge of u...Read More

AI as a Co‑Pilot for SaaS Product Teams
The post explores how AI can act as a co‑pilot for SaaS product teams, enhancing every stage from idea generation to release management, while emphasizing com...Read More

Scent as Strategy: Leveraging Fragrance to Boost Focus, Mood, and Brand Loyalty
Fragrance isn’t just an accessory—it’s a powerful brain hack. Discover how scent shapes focus, emotion, and consumer loyalty, and get practical tips to em...Read More
0 Comments
Post Comment
You will need to Login or Register to comment on this post!