
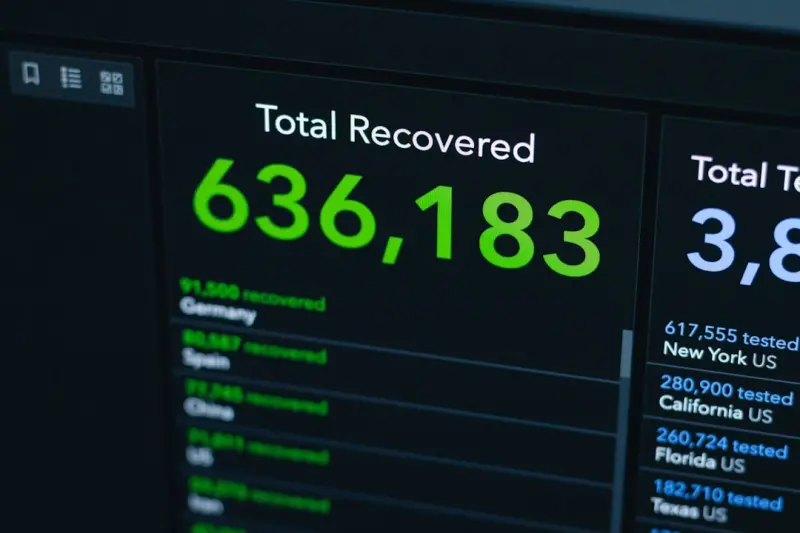
Why Real‑Time Cash Flow Dashboards Are the CFO’s New Compass
When I first stepped into the finance office of a fast‑growing SaaS startup, I was greeted by a wall of spreadsheets that looked more like a cryptic crossword than a clear picture of the company’s health. Rows of historical data, quarterly forecasts, and a handful of static charts promised insight, yet they left me feeling more confused than confident. Fast forward a couple of years, and the same CFO now swears by a real‑time cash flow dashboard that updates every few seconds, turning the once‑foggy landscape into a crystal‑clear map. In this post, I’ll walk you through why this shift matters, how it reshapes decision‑making, and the practical steps you can take to get there without drowning in tech jargon.
The Financial Storm: Volatility Is the New Normal
Every CFO knows that the only constant in finance is change. Market fluctuations, subscription churn, unexpected capital expenditures, and the ever‑looming threat of regulatory shifts create a perpetual storm. Traditional budgeting cycles—often locked in quarterly or annual cadences—simply can’t keep pace. By the time a quarterly report is compiled, the underlying assumptions are already outdated, rendering the insights less actionable.
Enter real‑time cash flow visibility. Instead of a static snapshot, you gain a dynamic, continuously refreshed view of inbound and outbound cash. This isn’t just a nice‑to‑have; it’s a survival tool. When a major client delays payment, the dashboard flashes a warning, prompting you to renegotiate terms or tap a short‑term credit line before liquidity dries up. When a new product launch spikes revenue, you can instantly allocate resources to capitalize on the momentum.
From Reactive to Proactive: The Dashboard Mindset
Imagine you’re piloting a plane. Would you prefer a heads‑up display that tells you your altitude, speed, and fuel level in real time, or a post‑flight report that shows you where you were a few hours ago? The dashboard is that heads‑up display for finance. It shifts the CFO’s role from reacting to problems after they’ve surfaced to anticipating them before they become crises.
- Immediate anomaly detection: Sudden drops in ARR or spikes in operating expenses trigger alerts.
- Scenario simulation: Drag a slider to see how a 5% churn increase would affect runway in the next 12 months.
- Cross‑functional alignment: Marketing sees the impact of campaign spend on cash, while product teams understand the cash implications of feature rollouts.
These capabilities break down silos, fostering a culture where every department can see the financial ripple effects of its actions in real time.
Building the Foundation: Data Hygiene and Integration
Before you can trust a dashboard, you must ensure the data feeding it is clean and consolidated. Many SaaS firms suffer from data silos—CRM, billing, expense management, and payroll each speak their own language. The first step is to implement a single source of truth architecture, often achieved through an integration platform that pulls data via APIs into a data warehouse.
While you’re at it, consider the power of semantic SEO principles when structuring your data models. Just as semantic SEO aligns content with user intent, a semantic data model aligns financial metrics with business outcomes, making it easier to surface the insights that truly matter.
The Tech Stack: Choosing the Right Tools
Not every visualization tool is built for finance. Look for platforms that support:
- Secure, role‑based access controls (your finance team needs granular permissions).
- Native connectors to popular SaaS billing systems like Stripe, Chargebee, or Recurly.
- Custom calculation fields for metrics such as net revenue retention, LTV:CAC ratio, and operating cash flow.
- Real‑time data refresh capabilities, ideally sub‑minute intervals.
Solutions like Looker, Tableau, or newer finance‑focused products such as Finmark or Pulse can meet these criteria. The key is to avoid “pretty charts” that lack depth; you want a platform that lets you drill down from a high‑level cash balance to the individual invoice that caused a dip.
Designing for Action: Dashboard Best Practices
A dashboard is only as good as its usability. Here are some design rules I live by:
- Prioritize the most critical KPIs. The top of the screen should show cash on hand, runway, and burn rate. Anything less critical belongs on a secondary tab.
- Use color intentionally. Green for positive trends, red for negative, and amber for warnings. Overuse of bright colors creates fatigue.
- Keep it simple. One visual per metric. Avoid cluttered combo charts that force the eye to work harder.
- Enable instant actions. Pair alerts with one‑click actions—e.g., a “request credit line” button appears when cash falls below a threshold.
When the dashboard feels intuitive, it becomes a habit rather than a chore, and the finance team will check it multiple times a day, just like a weather app.
Linking Finance to Growth: The Role of Intent‑Driven Link Building
You might wonder, “What does intent‑driven link building have to do with cash flow?” The answer lies in the way growth and finance intersect. When your marketing team earns high‑quality backlinks, organic traffic rises, leading to more trial sign‑ups and, eventually, revenue. By tracking the financial impact of each link acquisition in real time, you can allocate budgets to the channels that truly move the needle.
In practice, this means tagging inbound links with UTM parameters that feed directly into your revenue attribution model. Your cash flow dashboard then reflects the incremental cash generated from each link source, allowing the CFO to approve or reject spend based on measurable ROI rather than gut feeling.
Risk Management: Stress‑Testing Cash Flow in Real Time
Traditional stress tests are static exercises performed annually. With a live dashboard, you can run continuous stress scenarios. For example, toggle a “high churn” switch and watch how your runway shrinks from 18 months to 9 months within seconds. This immediacy empowers the leadership team to make preemptive moves—like tightening credit terms or launching retention campaigns—before the worst‑case scenario materializes.
Moreover, real‑time monitoring supports compliance. If a new regulation requires you to maintain a minimum liquidity ratio, the dashboard can automatically flag violations and log the breach for auditors.
Culture Shift: From Spreadsheet Guardians to Data‑Driven Leaders
Implementing a real‑time dashboard isn’t just a tech project; it’s a cultural transformation. Finance professionals often act as the gatekeepers of data, wary of sharing “raw numbers.” To succeed, you must foster a mindset where data is a shared asset, not a private vault.
Start with small wins: invite product managers to a monthly cash‑flow review, let them see how feature releases affect cash, and encourage them to suggest optimizations. Celebrate those moments when a cross‑functional team collectively averts a cash shortfall—those stories become the narrative that embeds the dashboard into the company’s DNA.
Measuring Success: KPI Dashboard for the Dashboard
Even the tool that tracks performance needs its own performance metrics. Consider monitoring:
- Adoption Rate: Percentage of finance team members logging in daily.
- Alert Response Time: Average time taken to act on a cash‑flow warning.
- Decision Velocity: Time from insight (e.g., a revenue dip) to a documented action.
- Accuracy Improvement: Reduction in forecast variance after dashboard implementation.
When these meta‑KPIs show upward trends, you have concrete proof that the dashboard is delivering value beyond pretty visuals.
Future Glimpses: AI‑Powered Predictive Cash Flow
Looking ahead, the next evolution will be predictive analytics that blend historical trends with real‑time inputs to forecast cash flow minutes ahead. While that sounds futuristic, many SaaS platforms already offer machine‑learning modules that predict churn or upsell likelihood. Integrating those predictions directly into your cash flow dashboard will close the loop, turning forecast into action instantly.
Until then, focus on mastering the fundamentals: clean data, robust integrations, intuitive design, and a culture that embraces transparency. When those pieces are in place, the dashboard becomes a living, breathing financial compass that guides your company through both calm skies and stormy weather.

Miranda Murphy: Experienced freelance writer with a decade of storytelling expertise. Let's create something amazing together!
Related Posts

The Moment Most People Realize They Need a Financial Reset
A financial reset is rarely the product of a single event; it is the culmination of signals that, ta... Read More

Turning Pocket Money into a Financial Superpower: A Behavioral Playbook
Learn how tiny, habit‑based tweaks—from micro‑budgeting to gamified savings—can transform yo... Read More

Real‑Time Payments: The CFO’s Secret Weapon for Agile Cash Flow
Real‑time payments are reshaping finance, enabling CFOs to turn cash collection into an instant, s... Read More
Top Posts

Zero‑Trust Home Office: A Practical Playbook for Modern Security
Discover a step‑by‑step zero‑trust strategy for remote workers, turning your home network into a fortified digital fortress without sacrificing convenienc...Read More

Mental Health in the Digital Age: A Complex Landscape
Mental health in the digital age is a complex issue. Learn how to navigate the challenges and opportunities of technology and mental health....Read More

When Do Dogs Stop Teething, and Why Do They Chew? A Comprehensive Guide for Pet Owners
The period when a puppy’s mouth is full of tiny, wobbly teeth can be both adorable and perplexing for new dog owners. The incessant gnawing on shoes, furnitur...Read More

Content Creation Tools to Develop Powerful Content
In today's digital landscape, content is king. It's the backbone of any successful marketing strategy, and the quality of your content can make or break your on...Read More
0 Comments
Post Comment
You will need to Login or Register to comment on this post!